RSI Trading Signals
Optimize Market Timing & Identify Key Reversal Points
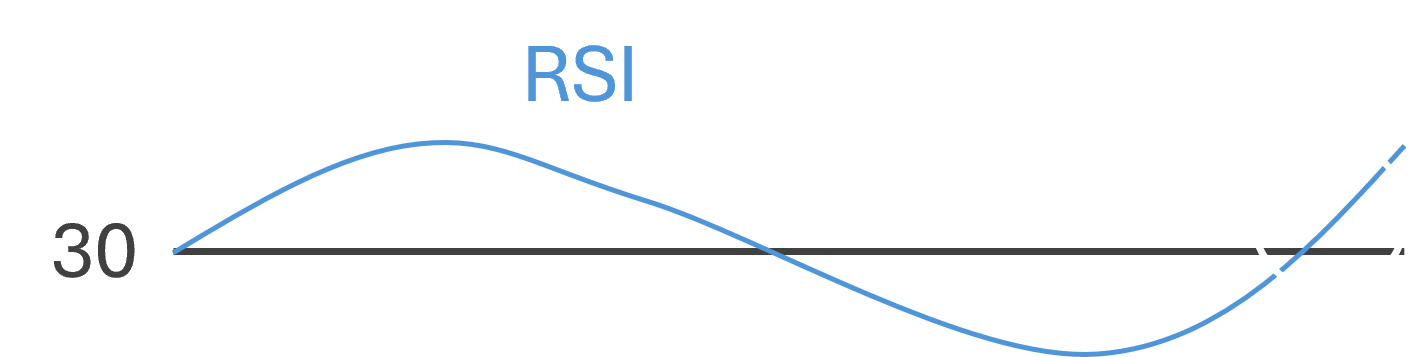
RSI Crossing 30 Line Upwards
The RSI Crossing 30 Upwards signal occurs when the Relative Strength Index (RSI) moves from below 30 to above 30. The RSI is a momentum oscillator that measures the magnitude of recent price changes to determine overbought or oversold conditions in an asset. It is calculated by comparing the average gains and average losses over a set period—typically 14 periods—and is then scaled to produce a value between 0 and 100. When the RSI is below 30, it indicates that the asset is in oversold territory, suggesting that recent losses have outweighed gains over the calculation period. This condition implies that the asset may have experienced excessive selling pressure.
The upward crossing of the 30 level signifies that the average gains are beginning to outweigh the average losses, marking a change in the momentum of price movements. This transition reflects a shift in the underlying price dynamics: the rate of decline is slowing down, and the asset’s performance is starting to show signs of improvement. The crossing itself is a clear numerical event within the RSI, indicating that the market is emerging from a state of oversold conditions. It is solely based on the internal calculation of the RSI, which quantifies the balance between upward and downward price movements. The RSI’s design to smooth out price fluctuations allows it to filter out some of the market noise, making the crossing of the 30 level a significant event that reflects a genuine shift in momentum. As the RSI moves upward past 30, it demonstrates that the asset’s price behavior has undergone a measurable change, transitioning from a period dominated by losses to one where gains are starting to take hold.