Bollinger Bands Trading Signals
Identify Trends, Exploit Price Breakouts
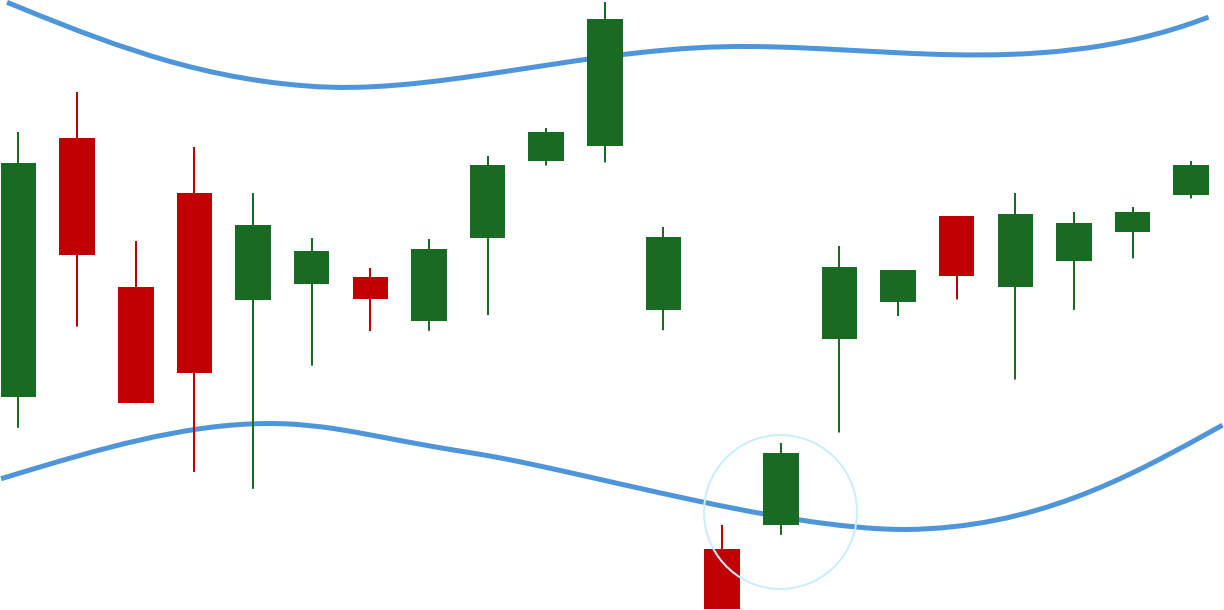
Bollinger Rebound from Lower Band
The Bollinger Rebound from Lower Band signal is triggered when the closing price of an asset, which has been trading below the lower Bollinger Band, crosses above it. The Bollinger Bands consist of three lines: the middle band, which is typically a 20-period simple moving average (SMA), and the upper and lower bands, which are derived from the middle band and the asset’s historical volatility. The bands expand and contract based on the asset’s price volatility, with the lower band representing a level of support and the upper band acting as resistance.
When the closing price falls below the lower Bollinger Band, it suggests that the asset is in an oversold condition, potentially indicating that the price has deviated significantly from its average value. This situation may attract buyers looking for a bargain or a reversal in the downtrend. The subsequent move above the lower band is interpreted as a rebound from the oversold condition, signaling that the asset’s price is returning to a more typical range. This behavior is often seen as a bullish signal, as it implies that the selling pressure has subsided, and buyers are regaining control.