MACD Trading Signals
Turning Momentum into Opportunities
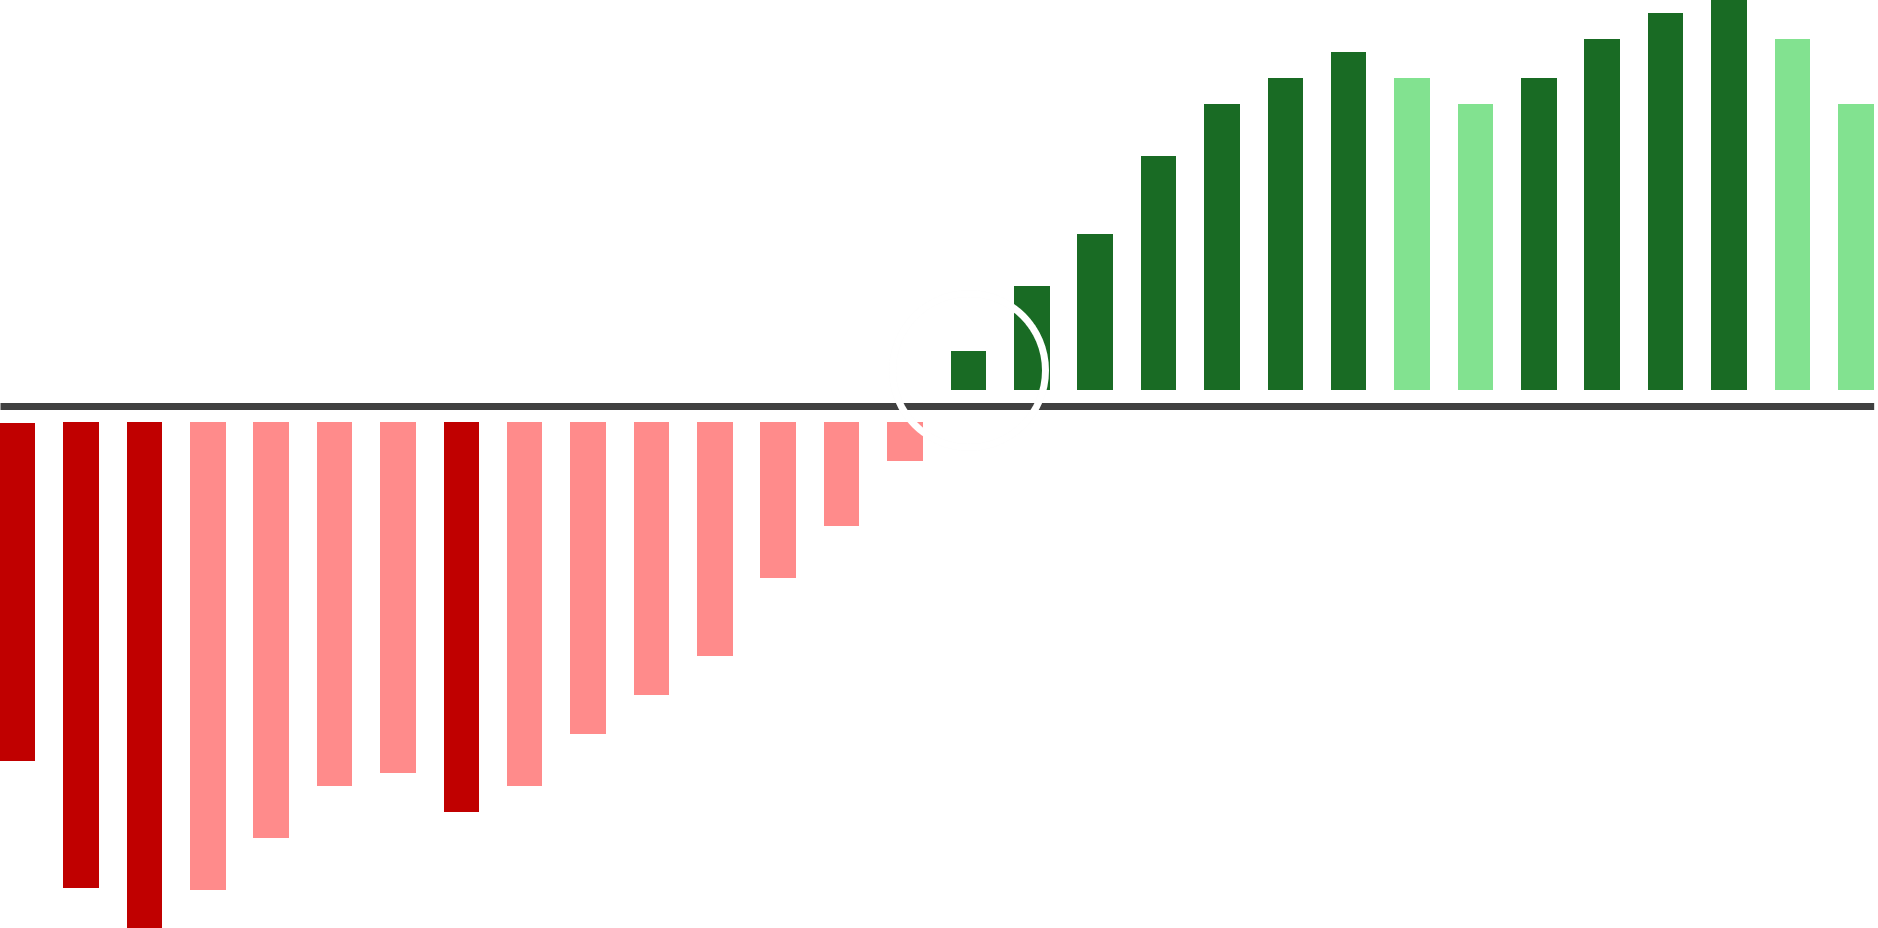
MACD Histogram Crossing from Negative to Positive
The MACD Histogram Crossing from Negative to Positive is widely regarded as a bullish signal that indicates a potential shift in market momentum. This signal is generated by the MACD indicator, which is calculated by subtracting the slow exponential moving average (EMA) from the fast EMA, typically using periods of 26 and 12, respectively. The resulting MACD line is then compared to its signal line — a 9-period EMA of the MACD — to create the MACD Histogram.
Essentially, the histogram represents the difference between the MACD line and the signal line, highlighting moments of convergence or divergence. When the histogram is negative, it suggests that the MACD line is below the signal line, generally indicating bearish momentum. A crossover from negative to positive, however, signifies that the MACD line has risen above the signal line, hinting at an emerging bullish trend. This transition is often interpreted by traders as an early signal to consider entering a long position.

MACD Histogram Double Rise in Negative Zone After Downward Movement
This signal occurs when the MACD Histogram, which initially displayed a downward trend and remained in negative territory, shows two consecutive increases. When the histogram is in negative territory, it generally indicates that bearish momentum is in control. However, after a clear downward movement, observing two consecutive rises in the histogram suggests that this bearish pressure may be weakening.
The first rise represents an initial recovery attempt, as the gap between the MACD line and the signal line narrows. The subsequent rise reinforces this recovery, implying that buyers might be gaining strength and the potential for a bullish reversal is increasing. This pattern provides traders with an early indication that the downtrend might be coming to an end.
How can WhatWorks help?
Validate Signal Success
Use the tool to analyze how often MACD crossovers or histogram shifts have historically led to profitable trades. This helps traders verify the reliability of popular signals before acting.
Compare Market Trends
Analyze how MACD signals performed for a specific stock compared to the broader market. Identify whether a signal aligns with overall trends or indicates a unique opportunity.